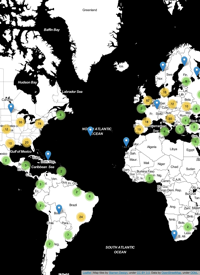
In celebration of St Patrick’s day last week, I decided to dig up an old dataset from when I was living/working in Ireland on historical Irish populations by county, and have a play with D3js and cartograms. Click here to view it ‘live’. If you’ve read any of my previous posts, you’ll know that I like cartograms as a useful and fun way to visualize data. The Great Famine was an important and significant event in Irish (and global) history, and cartograms provide a fun and informative way to explore the resultant population change in Ireland ...
- Fri 28 March 2014 cfarmer
New Journal: Spatial Demography
Thu 06 June 2013 cfarmerI have recently joined the editorial team at Spatial Demography — a new journal outlet for demographers and others who use spatial data, methods, and theory.
A bit more about the journal:
Spatial Demography [ISSN: 2164-7070 (online)] focuses on the spatial analysis of demographic processes. This cross-disciplinary work involves modern demographic data visualization, enhanced geo-referenced data availability, and spatial statistics, facilitated through full color graphics, motion video tools, and a quick time-to-publication. The journal publishes research articles, essays, research reports, data sources, computing software, teaching notes, and book reviews on a wide range of topics of interest to the social demographer.
1 / 1
