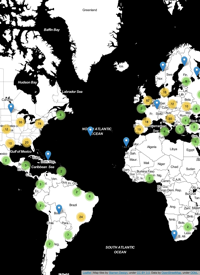
Data visualization is part of my everyday work-flow. More often than not, I’m playing around with my data in a GIS to tease out interesting or informative spatial patterns, or to ensure that I’m getting the results that I’m expecting. As a result, I am constantly trying out different classification schemes to help me generalize spatial patterns, highlight outliers and/or patterns, or just plain mess around with my data.
Playing around with classification algorithms: Python and QGIS
Thu 23 September 2010
cfarmer
