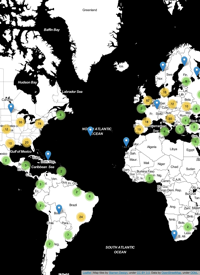
This is useful for visually exploring R spatial data such as
SpatialPointDataFrames or SpatialGridDataFrames. By clicking on various
features, the value at that point will be displayed.
library(rgdal)
y = readGDAL(system.file("pictures/Rlogo.jpg", package="rgdal")[1], band=1)
y.grid = y@grid
y.coords = coordinates(y.grid)
image(y)
identify(x=y.coords, y=NULL, n=1)
where x and y refer to coordinates (in this case because y.coords
contains both x and y coordinates, y can be set to NULL), and n is the
number of features to identify.
