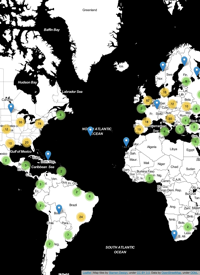
Its been quite a while since my last post, and its Friday and I was feeling creative, so I decided to map something! I’ve been looking for an excuse to produce a nice graphic like the one Anita Graser created to represent Vienna’s green-spaces. She used Quantum GIS to produce a hexagonal grid for representing the density of Viennese trees instead of the standard heat map or kernel density map, and the results are quite nice! I’m a huge fan of QGIS, but I tend to do most of my work in R, so I decided to ...
Because its fun to map stuff…
Fri 30 March 2012
cfarmer
