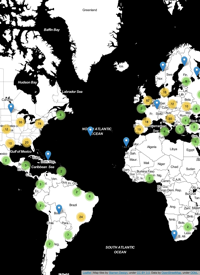
Data visualization is part of my everyday work-flow. More often than not, I’m playing around with my data in a GIS to tease out interesting or informative spatial patterns, or to ensure that I’m getting the results that I’m expecting. As a result, I am constantly trying out different classification schemes to help me generalize spatial patterns, highlight outliers and/or patterns, or just plain mess around with my data.
- Thu 23 September 2010 cfarmer
PostGIS ‘select’ statement as vector layer in QGIS
Tue 27 April 2010 cfarmerSeveral colleagues of mine have asked whether it is possible to visualise the results of a
SELECTstatement on a PostGIS database that returns spatial data in QGIS. In other words, can we map the results of something like:SELECT id, st_union(the_geom) FROM spatial_table GROUP BY id;
My usual answer to this in the past has been “not yet…”, but now thanks to Giuseppe Sucameli and Jürgen E. Fischer, the answer is a resounding “yes!”. A recent patch to QGIS trunk now makes custom Postgres queries possible via the postgres data provider.
Parallel bootstrapping with R
Wed 21 April 2010 cfarmerIn a recent post, I mentioned that I was testing the stability of clusters generated from a modified network partitioning algorithm using bootstrap resampling techniques. I also mentioned that I was doing this in R, using the very nice foreach package published by REvolution Computing. To show just how nice this package is, below is a minimal example of bootstrapping a network partitioning algorithm which takes advantage of a multicore processor:
Why I’m *not* going to use Mendeley
Wed 14 April 2010 cfarmerBesides the obvious: “It’s not open source!”, I’m also not making the switch from Zotero to Mendeley for my academic reference management needs due to the answer to this question on the Mendeley FAQ page:
Is Mendeley free?
The straight answer would be yes and no. Yes, it’s free, because: Everything you get when you sign up to Mendeley is completely free and will always remain free - including the features described in What is Mendeley?
No, it’s not completely free, because: At a later point in time, we will expand upon the existing features and introduce ...
Speeding up geoprocessing in QGIS
Thu 01 April 2010 cfarmerLast night I had an uncontrollable urge to make geopoprocessing in QGIS better, faster and more fun! I had come across a couple of posts (here, here) on the idea of a cascaded union operation, and since it has recently been added to GEOS (which QGIS uses for its geometry operations), I thought I’d give a much needed boost to the fTools union tool and related functions.
QGIS developer meeting update
Wed 11 November 2009 cfarmerLast week I attended the 2009 QGIS Developers Meeting in Vienna, Austria. We all had a really good time, met many new people, and actually got a lot done in the process. There have been updates about the meeting (hackfest) on the QGIS blog, and Tim Sutton has written a few words about our progress as well. I’m not going to repeat what others have said, but I would like to give a quick update on the work that I was doing at the meeting, and show off the new geoprocessing features now available to all QGIS developers (Python and C++).
Introduction to Open Source Geospatial Software
Fri 25 September 2009 cfarmerAnnouncing an opportunity to learn about the leading edge free and open-source technologies for desktop and web-based mapping and data analysis. This is a two day Masterclass focusing on introducing participants to the wonderful world of open source geospatial software. Check out the announcement from the Postgraduate Statistics Centre at Lancaster University.
Voronoi polygons with R
Wed 16 September 2009 cfarmerTo create a nice bounded Voronoi polygons tessellation of a point layer in
R, we need two libraries:spanddeldir. The following function takes aSpatialPointsDataFrameas input, and returns aSpatialPolygonsDataFramethat represents the Voronoi tessellation of the input point layer.
