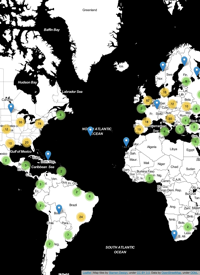
One of my goals for this year is to spend more time and effort developing effective Visualizations for my various research projects, in an effort to make my research more accessible to others. This is one thing that I think many academics are particularly bad at: letting others know what they are up to, and why it might be something worth looking at. In order to avoid this pitfall, I plan to focus on producing interactive, web-based visuals suitable for a more general audience in addition to more traditional forms of research dissemination such as journals and conference papers. It is my hope that by doing this, I will be making my research more readily available to those who might actually be able to use it, and maybe even create some compelling Visualizations in the process. While I’m not quite ready to start creating full-blown interactive websites yet, I thought it might be a good idea to start with something small to get the ball rolling; so I put together an upgraded version of my previous map of visitors to www.carsonfarmer.com.
Research dissemination and interactive visuals
Tue 10 April 2012
cfarmer