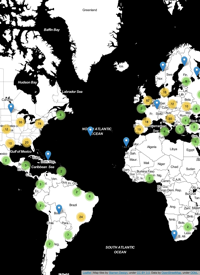
With the recent (and long anticipated) release of Quantum GIS 2.0, there has been a lot of ‘buzz’ in the open source geospatial community about all the cool new features that QGIS now boasts, and how far it has come in such a short time. I was recently inspired by such a post by Anita Graser (aka Underdark) (who is a wonderfully talented cartographer/designer) on data driven labeling in QGIS, so I thought I’d throw something together on a gray Friday afternoon to test it out. I also wanted an excuse to play around with Reveal.js slides in IPython notebook, so I produced the following slide show using the images from QGIS and some IPython magic:
