1. PhD position in GeoInformatics and Housing research

    Thu 25 October 2012
    cfarmer

    The CGI is looking for a talented PhD student to fill an interdiciplinary PhD Studentship co-funded by the Economic and Social Research Council and HOME Housing Association. Suitable candidates should apply by 23 November 2012 for a start date of 1 January 2013. Have a look at the CGI vacancies webpage for more details. This is a great opportunity for students interested in using and developing state-of-the-art methods in geoinformatics and applying them to fundamental questions in the social housing sector.

    read more

    comments

  2. Carson moves to the Big Apple

    Tue 16 October 2012
    cfarmer

    image

    I am very excited to announce that I will soon be moving to New York to take up a faculty position in the Department of Geography at Hunter College of the City University of New York. The plans have been in motion for quite a while, and now that my wife and I have started to pack up our stuff, I thought I’d post something here to make it ‘official’. I start full time in NY at the end of January, at which point I will be diving head first into teaching and research. I am really looking forward ...

    read more

    comments

  3. manageR and rpy2 installation problems

    Sat 06 October 2012
    cfarmer

    Unfortunately, I haven’t had much time recently to update or work on manageR, but I’m hoping that will change in the next few months… Having said that, there are quite a few people out there that have been having trouble installing manageR (and the required rpy2) on their system to get things working at all! I have had some individuals provide possible fixes and suggestions on how to get things working properly on various platforms, and I’m going to use this post to amalgamate them, and hopefully create a one stop post for all your rpy2 and manageR needs. I’m also hoping that people will post potential fixes in the comments to help others with more specific problems?

    read more

    comments

  4. cartogram updates

    Fri 10 August 2012
    cfarmer

    It seems my Olympic medals cartogram is getting a bit more attention (Guardian data blog, and Telegraph data and graphics blog), so I’ve updated a few things and wanted to highlight/explain them a bit here.

    image

    Firstly, you can now explore the medal data together with population and GDP as well as without any warping to get a feel for how much things change. Secondly, in order to be able to display the map in a way that is familiar to most people (i.e., landscape style), I had to take a few liberties in terms of representation. For ...

    read more

    comments

  5. Cross-browser iframe scaling

    Mon 06 August 2012
    cfarmer

    This is just a quick post to document an annoyance (and solution) that I’ve recently discovered when trying to scale a webpage embedded in another page using an iframe. When trying to come up with a nice way to embed this page inside this page, I found that webkit based browsers were not behaving as they should. After a lot of fiddling about, I discovered that the following css seems to fix the issues:

    #wrap {  
        width: 630px;
        height: 300px;
        padding: 0;
        overflow: hidden;
    }
    #frame {  
        -ms-zoom: 0.5;
        -ms-transform-origin: 0 0;
        -moz-transform: scale(0.5);
        -moz ...

    read more

    comments

  6. Olympic cartogram

    Thu 02 August 2012
    cfarmer

    The London 2012 Summer Olympics have generated quite a bit of buzz in terms of Visualizations and interesting data analysis. In fact, news sites here in the UK are doing all sorts of cools things with Olympic data, and The Guardian has an entire series devoted to Olympic data. A colleague of mine also pointed out a cool graphic on The Telegraph website, which is essentially a live cartogram of Olympic medal counts. The cartogram is basically a spatial bubble plot, with the size of the bubbles representing the number of medals obtained by each country. The location of each bubbled is based on the corresponding country’s approximate geographic location. The graphic is pretty effective, and it certainly tells a clear story.

    I’m a big fan of these types of abstract representations of space, so I thought The Telegraph’s graphic was pretty fun. Having said that, I’m always a sucker for a more ‘traditional’ rubber-sheet cartogram, which is generally less abstract than a bubble plot, but can sometimes lead to dramatic results. Since I felt like the only person on the internet without their own Olympics Visualization, I decided to throw 
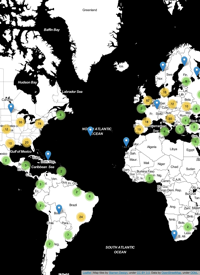
together a cartogram to visualize Olympic medal achievements. Drawing inspiration from The Telegraph graphic, I created a rubber-sheet cartogram based on an iterative warping method. The ‘live’ version of the cartogram is available here (or by clicking on the image below). [UPDATE] If you’d like to include the map on a web page, you can now do that by including this in your HTML source:

    <iframe src="http://www.carsonfarmer.com/examples/olympic_countries/map.html" width=1230 height=545\></iframe>
    

    read more

    comments

  7. Paper published in Environmental Monitoring and Assessment

    Mon 30 July 2012
    cfarmer

    An article I worked on with Margaret E. Andrew, Trisalyn A. Nelson, Michael A. Wulder, George W. Hobart, and Nicholas C. Coops, “Ecosystem classifications based on summer and winter conditions”, has recently been published on-line, with Environmental Monitoring and Assessment. For now, the article can be cited as:

    Andrew, M. E., T. A. Nelson, M. A. Wulder, G. W. Hobart, N. C. Coops, and C. J. Q. Farmer (in press). Ecosystem classifications based on summer and winter conditions. Environmental Monitoring and Assessment. doi:10.1007/s10661-012-2773-z

    If you would like a copy, but do not have access to the article ...

    read more

    comments

  8. Visualization featured on wired.co.uk

    Tue 29 May 2012
    cfarmer

    A few weeks back the CGI and I were approached by Miguel Nacenta from SACHI about putting together an infographic for an article on FatFonts (also see my previous article) to be featured on the Wired (UK) magazine website. Since Wired is one of my favourite magazines, I jumped at the chance! Using data that Dr Timothy Stojanovic and I are working with as part of Tim’s work linking off-shore cumulative human impacts to on-shore terrestrial urbanization, I put together several infographics depicting human impacts on the oceans surrounding Edinburgh and London. One of these graphics was selected for ...

    read more

    comments

7 / 13

twitter

recent visitors